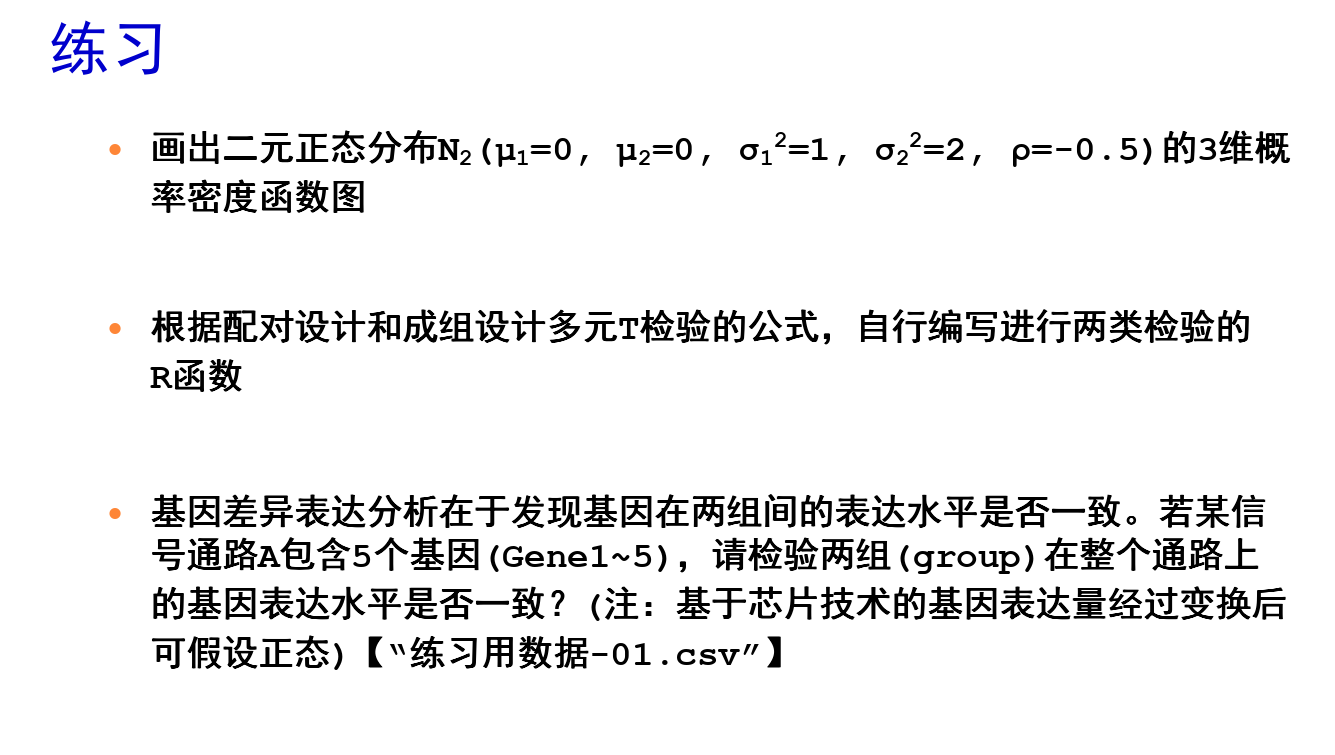
# Rstudio Server URL: http://202.195.187.9:8787/
# 账号密码与Linux一致

# 切换R路径
.libPaths("/home/biotools/anaconda3/envs/R4.3.1/lib/R/")
########################################################################
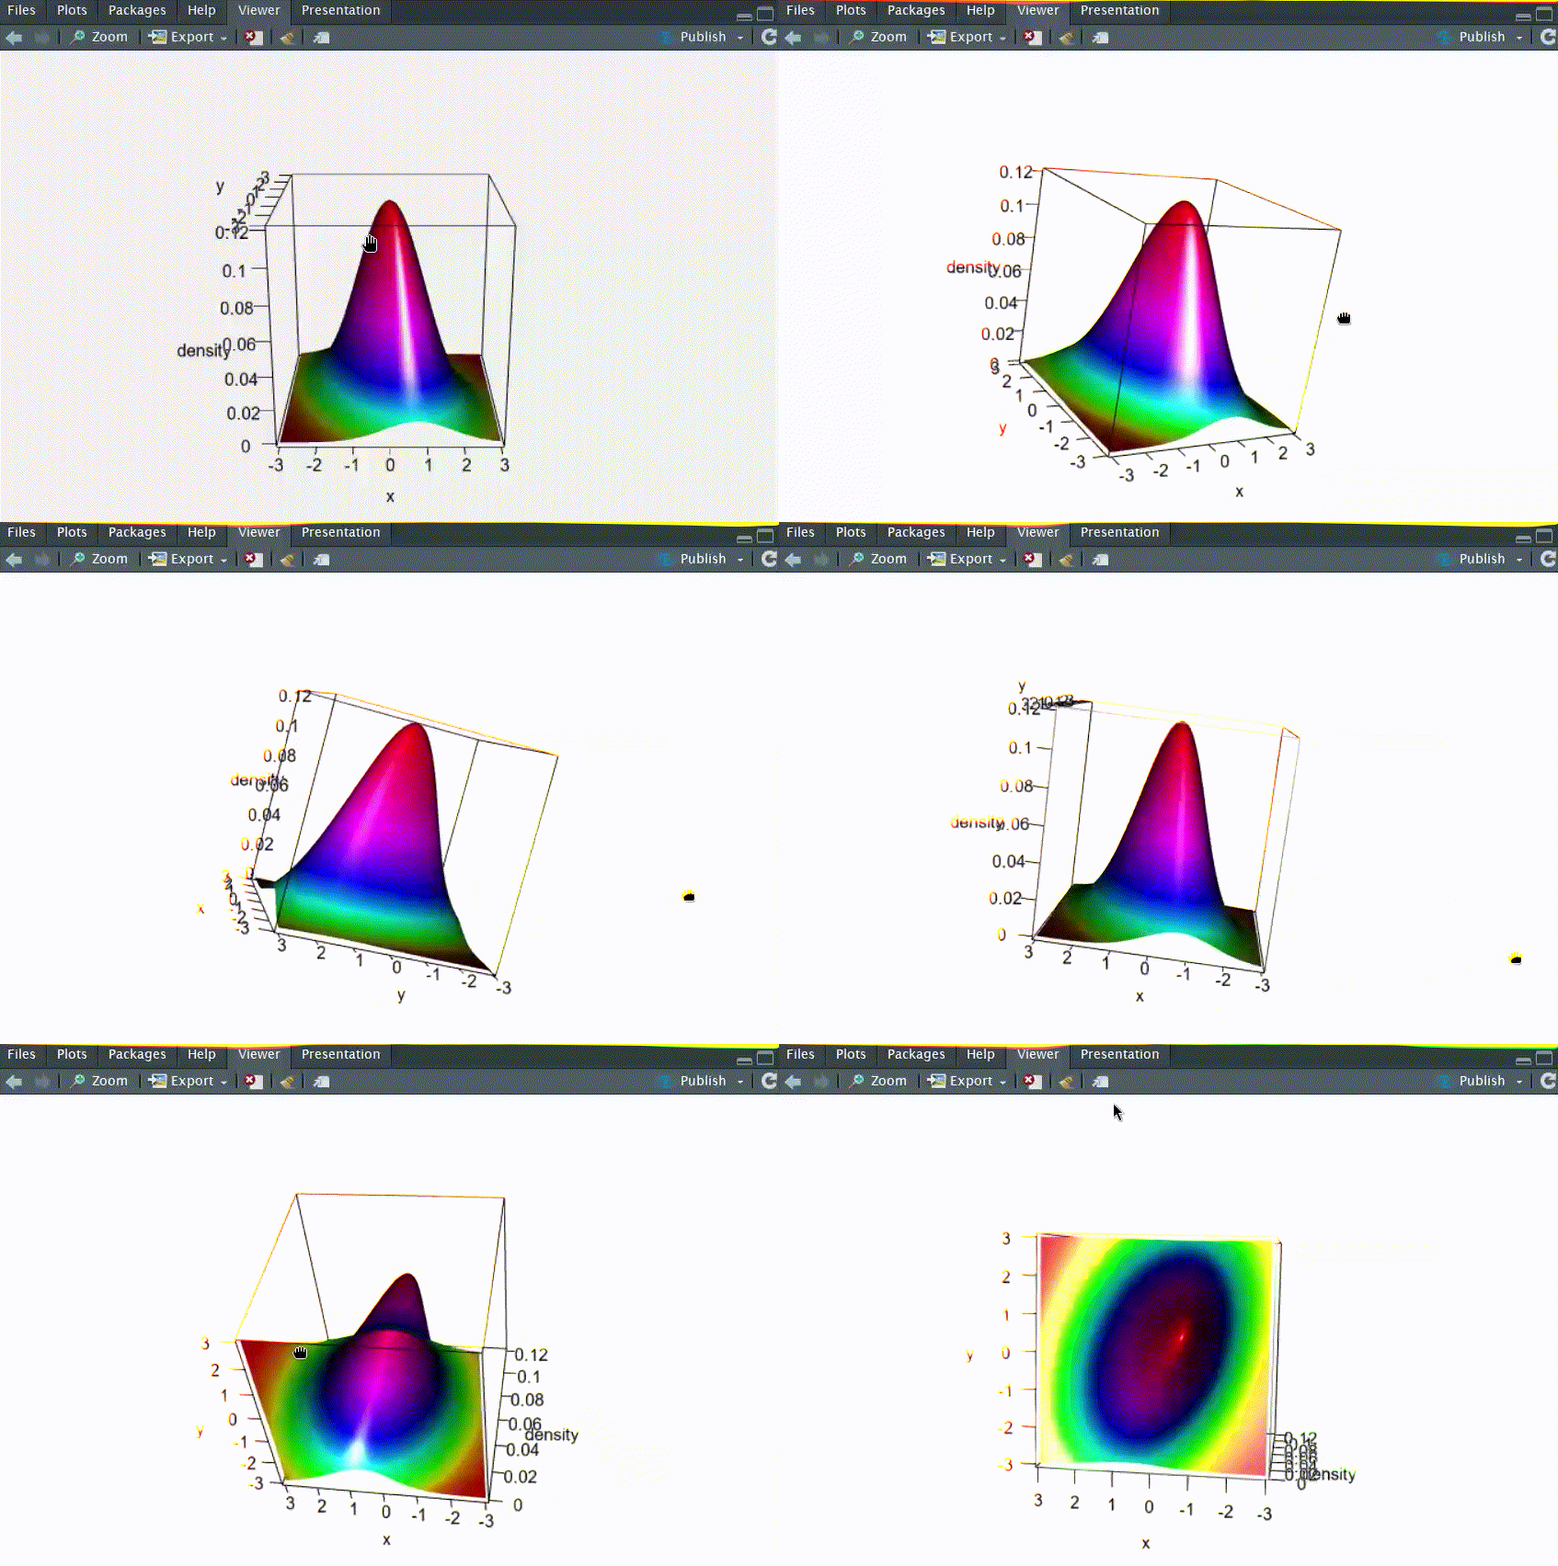
# Q1: 画出二元正态分布N2(μ1=0, μ2=0, σ12=1, σ22=2, ρ=-0.5)的三维概率密度函数图

library(mvtnorm)

mu = c(0,0)
sigma = matrix(c(1, -0.5, -0.5, 2), 2, 2)

# 准备三维坐标点
y.points = x.points = seq(-3, 3, length.out = 200)
z = matrix(0,nrow = 200, ncol = 200)

for (i in 1:200){
  for (j in 1:200){
    z[i,j] = dmvnorm(c(x.points[i], y.points[j]),
                     mean=mu, sigma=sigma)
  }
}

library(rgl)
res = list(x=x.points, y=y.points, z=z)

# 加颜色
coll = rainbow(length(z))[rank(z)]
persp3d(x=res, xlab="x", ylab="y", zlab="density", col=coll,rgl.printRglwidget = TRUE)

# 缺少"OpenGL functions"的解决方法
rglwidget()

########################################################################
# Q2: 根据配对设计和成组设计多元T检验的公式,自行编写进行两类检验的R函数
# 定义函数
RawHotellingsT2Test <- function(x, y=NULL, mu=NULL, test="f",...) {

  `HotellingsT.internal`  <-  function(x, y=NULL, mu, test) {
    n <- dim(x)[1]
    p <- dim(x)[2]

    # 单样本
    if(is.null(y))
    {
      test.statistic <- n*as.numeric(t(colMeans(x)-mu)%*%solve(cov(x))%*%(colMeans(x)-mu))*switch(test,f=(n-p)/(p*(n-1)),chi=1)
      df.1 <- p
      df.2 <- switch(test,f=n-p,chi=NA)
      p.value <- 1-switch(test,f=pf(test.statistic,df.1,df.2),chi=pchisq(test.statistic,df.1))
      return(list(test.statistic=test.statistic,p.value=p.value,df.1=df.1,df.2=df.2))
    }

    # 双样本
    n1 <- n
    n2 <- dim(y)[1]
    xmeans <- colMeans(x)
    ymeans <- colMeans(y)
    x.diff <- sweep(x,2,xmeans)
    y.diff <- sweep(y,2,ymeans)
    S.pooled <- 1/(n1+n2-2)*(t(x.diff)%*%x.diff+t(y.diff)%*%y.diff)
    test.statistic <- n1*n2/(n1+n2)*t(xmeans-ymeans-mu)%*%solve(S.pooled)%*%(xmeans-ymeans-mu)*switch(test,f=(n1+n2-p-1)/(p*(n1+n2-2)),chi=1)
    df.1 <- p
    df.2 <- switch(test,f=n1+n2-p-1,chi=NA)
    p.value <- 1-switch(test,f=pf(test.statistic,df.1,df.2),chi=pchisq(test.statistic,df.1))
    list(test.statistic=test.statistic,p.value=p.value,df.1=df.1,df.2=df.2)
  }

  if (is.null(y)) {
    DNAME <- deparse(substitute(x))
  } else {
    DNAME=paste(deparse(substitute(x)),"and",deparse(substitute(y)))
  }

  xok <- complete.cases(x)
  x <- x[xok,]
  if(!all(sapply(x, is.numeric))) stop("'x' must be numeric")
  x <- as.matrix(x)

  p <- dim(x)[2]

  if (!is.null(y)) {
    yok <- complete.cases(y)
    y <- y[yok,]

    if(!all(sapply(y, is.numeric))) stop("'y' must be numeric")
    if (p!=dim(y)[2]) stop("'x' and 'y' must have the same number of columns")
    y <- as.matrix(y)
  }

  if (is.null(mu)) mu <- rep(0,p)
  else if (length(mu)!=p) stop("length of 'mu' must equal the number of columns of 'x'")

  if (is.null(y)) version <- "one.sample.f"
  if (!is.null(y)) version <- "two.sample.f"

  res1 <- switch(version,
                 "one.sample.f"={
                   result <- HotellingsT.internal(x,mu=mu,test=test)
                   STATISTIC <- result$test.statistic
                   names(STATISTIC) <- "T.2"
                   PVAL <- result$p.value
                   METHOD <- "Hotelling's one sample T2-test"
                   PARAMETER <- c(result$df.1,result$df.2)
                   names(PARAMETER) <- c("df1","df2")
                   RVAL <- list(statistic=STATISTIC,p.value=PVAL,method=METHOD,parameter=PARAMETER)

                   RVAL}
                 ,
                 "two.sample.f"={
                   result <- HotellingsT.internal(x,y,mu,test)
                   STATISTIC <- result$test.statistic
                   names(STATISTIC) <- "T.2"
                   PVAL <- result$p.value
                   METHOD <- "Hotelling's two sample T2-test"
                   PARAMETER <- c(result$df.1,result$df.2)
                   names(PARAMETER) <- c("df1","df2")
                   RVAL <- list(statistic=STATISTIC,p.value=PVAL,method=METHOD,parameter=PARAMETER)

                   RVAL}
  )
  ALTERNATIVE="two.sided"
  NVAL <- paste("c(",paste(mu,collapse=","),")",sep="")
  if (is.null(y)) names(NVAL) <- "location" else names(NVAL) <- "location difference"
  res <- c(res1,list(data.name=DNAME,alternative=ALTERNATIVE,null.value=NVAL))
  class(res) <- "htest"
  return(res)
}

# 测试函数
# 读取文件
data = read.csv("./01/x1x2group.csv", header=T, sep = "\t")
# a1, a2分别为A组和B组的数据
a1 = read.csv("./01/a1.csv", header=F, sep = "\t")
a2 = read.csv("./01/a2.csv", header=F, sep = "\t")
a3 = read.csv("./01/a3.csv", header=T, sep = "\t")
RawHotellingsT2Test(a1, a2)

########################################################################
# Q3: 基因差异表达分析在于发现基因在两组间的表达水平是否一致。
#     若某信号通路A包含5个基因(Gene1~5),请检验两组(group)在整个通路上的
#     基因表达水平是否一致?【“练习用数据-02.csv”】
#    (注:基于芯片技术的基因表达量经过变换后可假设正态)

# 引入DescTools库
library(DescTools)

# 读取文件
data = read.csv("./01/Practice-01.csv", header=T, sep = ",")

# 提取group1
data_grp1 = data[data$group == 1,-which(names(data) == "group")]

# 提取group0
data_grp0 = data[data$group == 0,-which(names(data) == "group")]

# 成组设计多元T检验: Hotelling T²检验
HotellingsT2Test(data_grp0, data_grp1)

#formula形式
HotellingsT2Test(cbind(Gene1, Gene2, Gene3, Gene4, Gene5)~ group, data=data)
        Hotelling's two sample T2-test

data:  a1 and a2
T.2 = 8.0362, df1 = 2, df2 = 19, p-value = 0.002958
alternative hypothesis: true location difference is not equal to c(0,0)


        Hotelling's two sample T2-test

data:  data_grp0 and data_grp1
T.2 = 3.4884, df1 = 5, df2 = 94, p-value = 0.006166
alternative hypothesis: true location difference is not equal to c(0,0,0,0,0)


        Hotelling's two sample T2-test

data:  cbind(Gene1, Gene2, Gene3, Gene4, Gene5) by group
T.2 = 3.4884, df1 = 5, df2 = 94, p-value = 0.006166
alternative hypothesis: true location difference is not equal to c(0,0,0,0,0)

